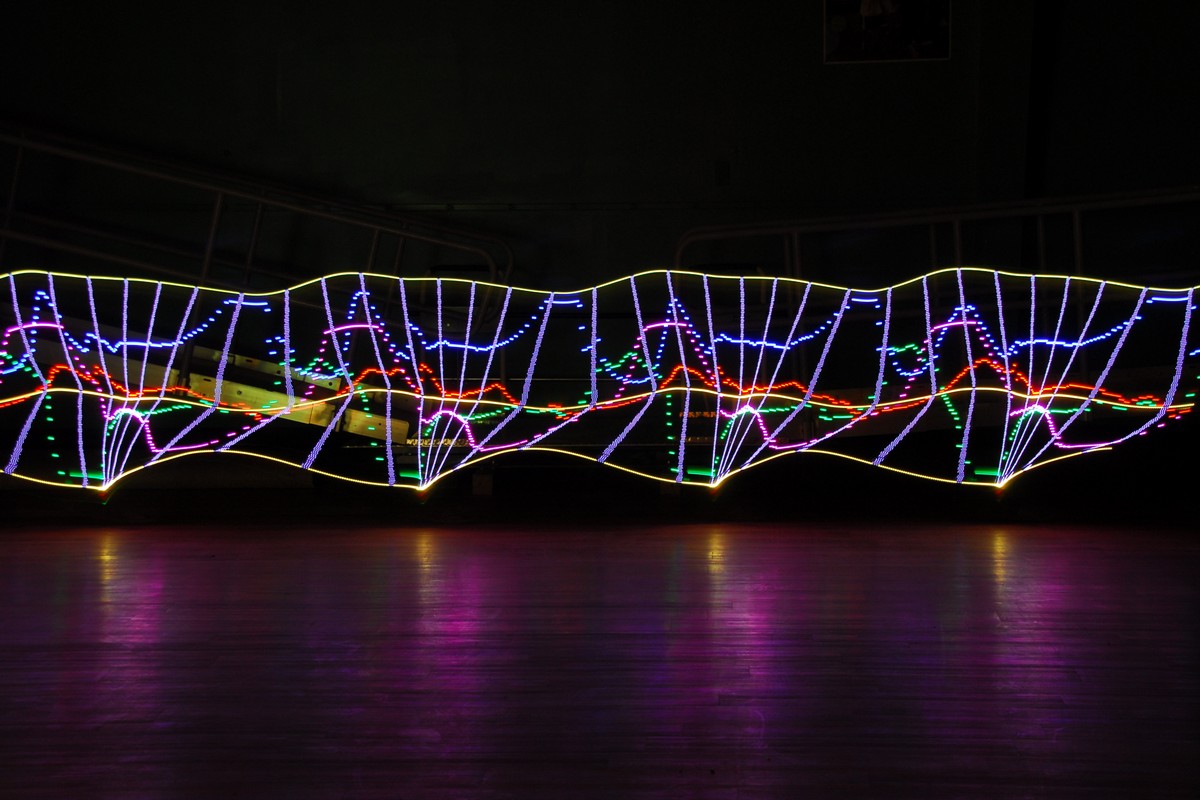
While working with a prosthetist (someone that designs, creates and fits artificial limbs) to record and analyze the behavior and performance of of amputees wearing prosthetics, we discovered that we could do more than just capture the information with gyroscopes and accelerometers… we could display it in real time. But that was too much for the human eye to handle. Using a programmable LED strip we were able to strobe different colors representing different axes and motions. And by taking a long exposure photograph in an otherwise dark room we were able to capture rather striking images of the exact data we were seeking to plot. It was real life data visualization.
